Visualizing complex relations in distributional analyses
The journalist Tilo Jung asked the (as to this date) Secretary of Social Affairs An drea Nahles (SPD), whether she would double the unemployment subsidies (“Hartz 4”), if she had the power for it. Andrea Nahles disagreed with this idea, because “to double the Hartz 4 subsidies would mean to double the poverty rate – sounds crazy but it’s a fact”. However, this statement is not true. Within our project, we developed various tools for easy comprehensive visualizations for allowing the scientific community and the public alike to investigate such claims.
Andrea Nahles’ problematic claim has its roots in the very complex nature of distributions of sub populations to the entire distribution as well as the construction of the poverty rate. To analyze the relevance of households with income from Hartz 4 for the poverty rate, we would need to know, where such households are located within the entire distribution and how influential they are for different parts of the distribution. This is important, because the official poverty rate is a function of the median (60% of its value) and the poverty rate is the share of all households falling below the poverty line. If an increase of Hartz 4 subsidies for 200% would actually increase the poverty rate, the affected households would need to rise the median considerably but should not push up the lower tail of the distribution.
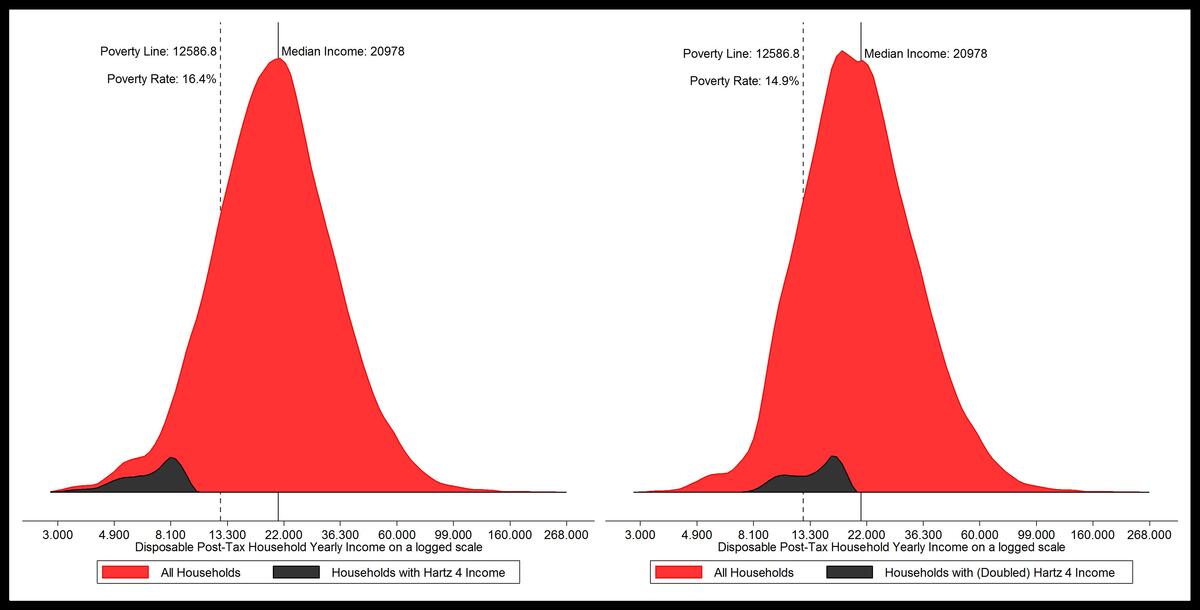
Figure 1 shows the opposite effect. The relative poverty rate in 2015 was 16.4% with a poverty line of about 12.600 Euro per year (for a single household). Hartz 4 households locate clearly below that line. We also see that they are only one group out of many within the low-income ranges. Pensioners, unemployed without receiv ing subsidies, apprentices, and low wage house holds are also located there.
The right hand side of the figure shows the same data with doubled Hartz 4 incomes. Even a doubling would not influence the median income. These households are only shifted within the lower half of the distribution, which does not change the median at all (because it is a separator for the upper and lower half). Consequently, the poverty line is also not affected. However, the income boost for Hartz 4 households would push a lot of them out of the lower tail, compressing the lower half and reducing the poverty rate to 14.9%.
This is only one out of many applications for the visualization tools we propose. From a technical view, we utilize Bokeh, a Python library that al lows us to visualize data and embed the resulting visualization into a HTML file. Furthermore, with Bokeh, we can add user interactivity by linking web page widgets to JavaScript code, which en ables the manipulation of the visualization‘s data sources. Thus, we shift most of the necessary computation on the client side, thereby, reducing heavy server load. The resulting web pages run in any modern browser that supports JavaScript and allow the user to individually explore and understand the visualized context. In a next step, we plan to test the applicability of our tools using randomized user experiments.

